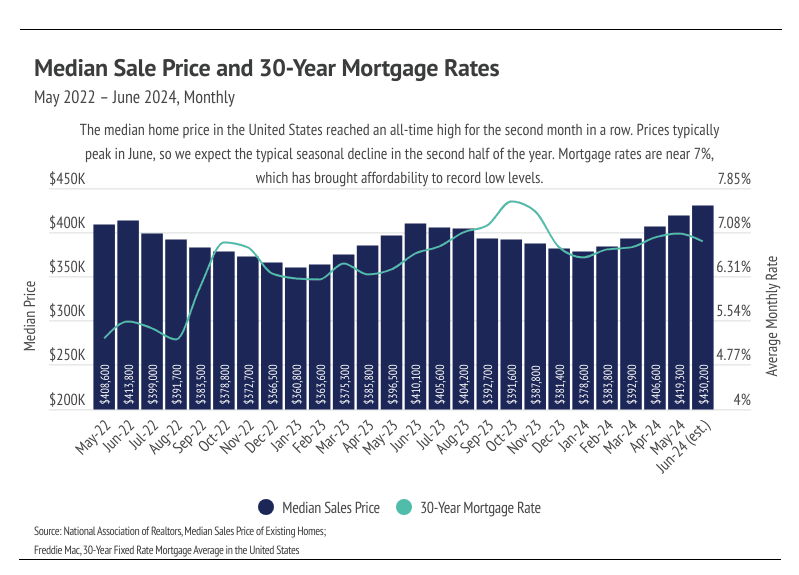
In June, prices rose for the fifth month in a row, peaking at an all-time high in June 2024. This also marks the 12th consecutive month of year-over-year price growth. According to typical seasonality, the median price peaks in June, so we expect prices to decline starting in July. Over time, prices generally move much higher in the first half of the year than they decline in the second half; you can think of it as two steps forward and one step back, year after year. Last year, for example, prices rose 13.7% from January 2023 to June 2023, then fell 7.7% from June 2024 to January 2024, which was still a year-over-year gain of 4.9%. This year will likely look similar, although we don’t think that prices will decline as much in the second half of 2024 as they did in 2023, especially if the Fed cuts rates in the fall. Even a minor rate cut, like the expected 0.25%, could significantly affect mortgage rates, as it would signal the beginning of more and more cuts.
For the moment though, we are starting summer with a combination of elevated mortgage rates and record high prices, which have brought affordability to an all-time low. Low affordability has resulted in fewer sales and growing inventory. Demand is still high relative to supply, even though inventory is building. We know that demand is still high because buyers are still buying at peak prices. From a historical context, we should’ve expected this to happen. We took a look at data from the 1980s to see how much home prices appreciated during a decade-long period of the highest mortgage rates in history. From January 1, 1980, to January 1, 1990, the 30-year mortgage rate ranged from 9.03% to 18.63%, with an average rate of 12.71%. Although home prices didn’t increase dramatically like they have in the recent past, inflation-adjusted home prices still increased about 8% during that decade. Today, with the strong U.S. economy, it was never very likely for home prices to stagnate or decline due to higher mortgage rates. However, high rates have slowed sales volume considerably, which has caused inventory to grow.
Overall, inventory growth is great news for the undersupplied U.S. housing market. According to data from the National Association of REALTORS® (NAR), inventory reached its highest level since August 2022. The market is still broadly undersupplied, but the increasing inventory level should cause rising home prices to slow. In the pre-pandemic seasonal trends, sales, new listings, inventory, and price would roughly all rise in the first half of the year and decline in the second half of the year. Sales and new listings have been far lower than usual since mortgage rates started climbing, which is to be expected. Because we don’t anticipate sales to pick up until the spring of 2025, inventory could continue to grow in the second half of the year.
Different regions and individual houses vary from the broad national trends, so we’ve included a Local Lowdown below to provide you with in-depth coverage for your area. As always, we will continue to monitor the housing and economic markets to best guide you in buying or selling your home.