Leave a Message

Thank you for your message. We will be in touch with you shortly.

The powerhouse of housing

The powerhouse of housing

The Big Story

Steady-ish as she goes

Quick Take:
  • The median home price in the United States landed 1% below the all-time high it reached in June 2022 after appreciating 13.6% in 2023. At the same time, mortgage rates are 1% higher than a year ago, which means the monthly cost of a home is 10% higher than last year.
  • The Fed hiked rates by 0.25% in mid-July to the highest level since 2001, which didn’t impact mortgage rates because the rate increase was expected. However, Fitch unexpectedly downgraded U.S. credit from AAA to AA+ on August 1 and, although we’ve maintained that 30-year mortgage rates would likely hover between 6% and 7% during 2023, the surprise downgrade may push mortgage rates slightly above 7% in the third quarter.
  • Broadly, the economy is doing well with strong GDP growth, high employment rates and job creation, falling inflation, and growing consumer confidence. Strong economics coupled with a low supply of homes have kept prices climbing, despite sustained elevated mortgage rates.
Note: You can find the charts & graphs for the Big Story at the end of the following section.

The powerhouse of housing

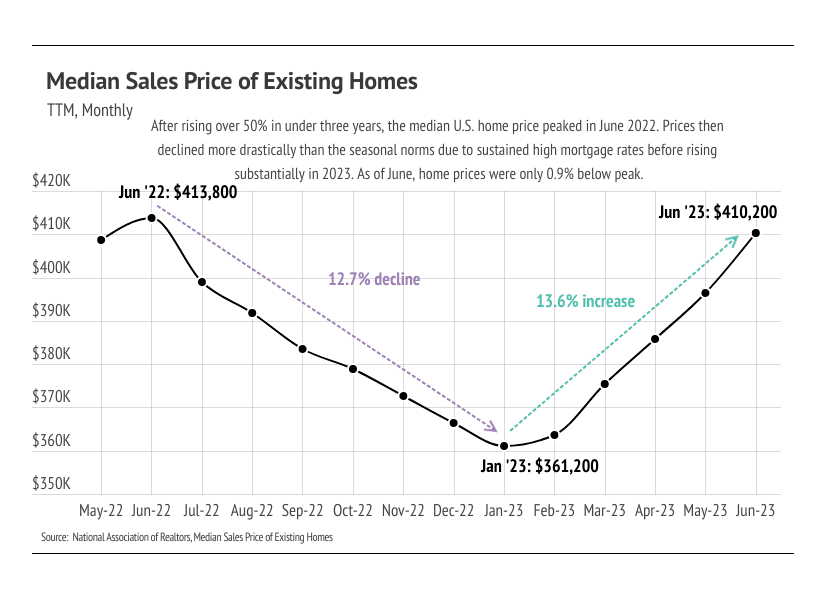
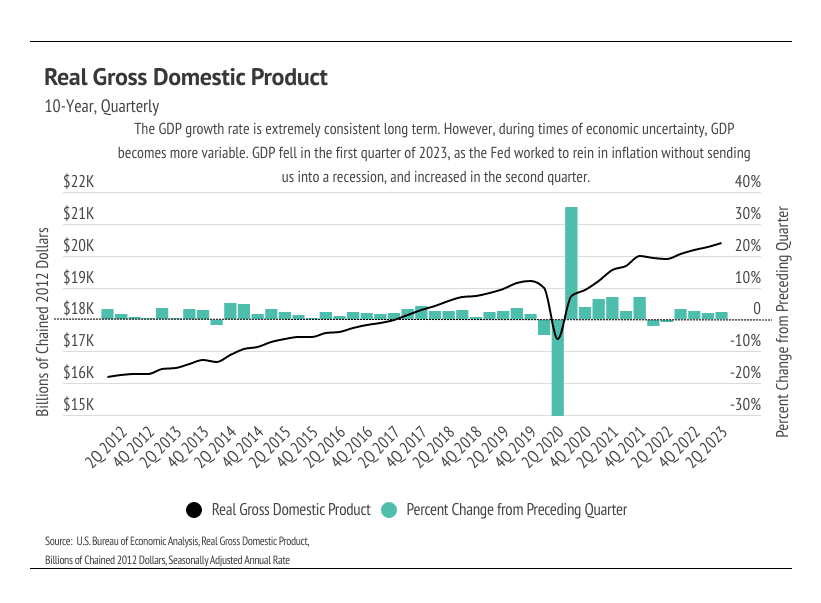
At the start of 2023, the economic consensus resoundingly predicted an impending recession, which has yet to come, and we’re happy to say that consensus has shifted to moderate economic growth. A “soft landing” — reducing inflation without a recession — seems more likely than ever. The economy is far from perfect, but the effect of largely positive economic news eventually leads to a more positive economic outlook from the average person. Job creation and GDP growth in the first half of 2023 have significantly beat expectations. Inflation is declining rapidly, and consumer confidence is the highest it’s been since February 2022. We can largely attribute the bounce in home prices to consumer perception, but consumer perception isn’t the only factor. Home prices certainly rose as recession worries subsided, even in the face of elevated mortgage rates. Supply, or lack thereof, has been the other major factor in the price rebound. Low, but growing inventory allowed for prices to increase quickly.
 
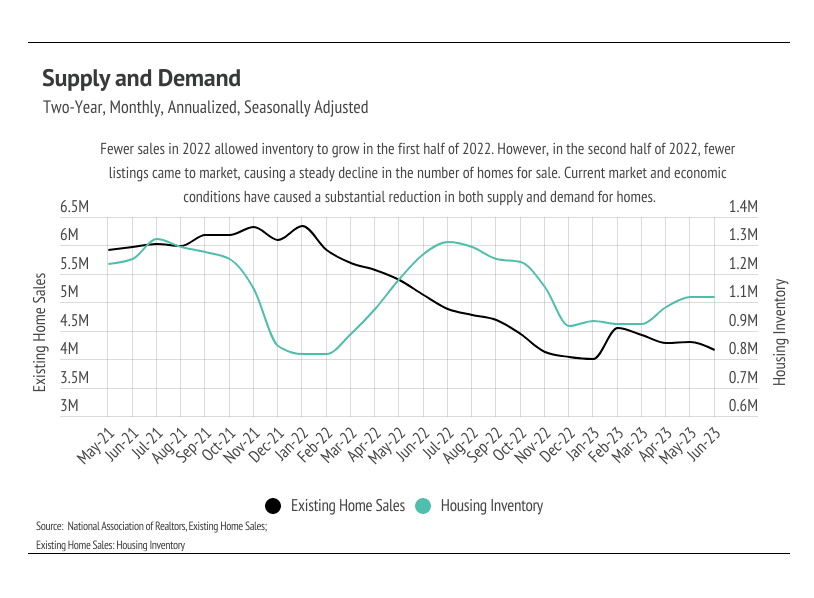
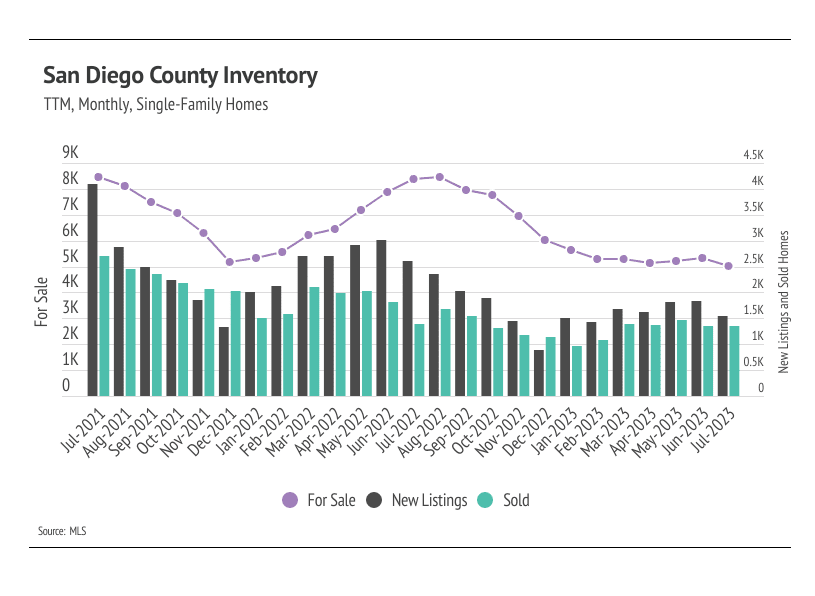
Housing doesn’t follow an Economics 101 supply-and-demand problem in part because it isn’t a commodity good. Inventory rising from near historic lows actually helps prices because more buyers can find a desirable home. During times of normal seasonality (at least pre-pandemic), inventory, new listings, sales, and prices all increase from January to July and decline from July to January. Any movement away from the hyper-low post-pandemic inventory levels is good for matching buyers with the right home, because buyers like enough selection to find the home they want in their desired location. Price appreciation this year indicates that even though sales are low, buyers are finding the homes they want.
 
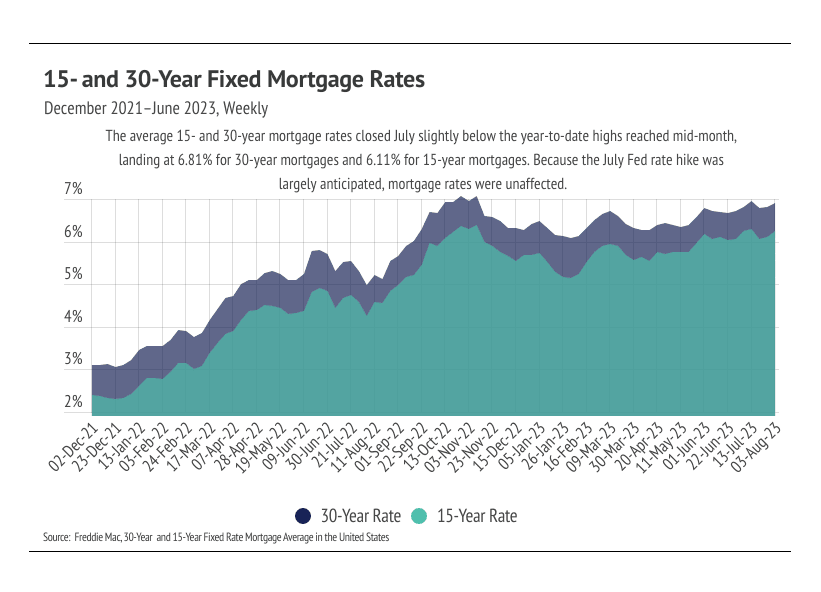
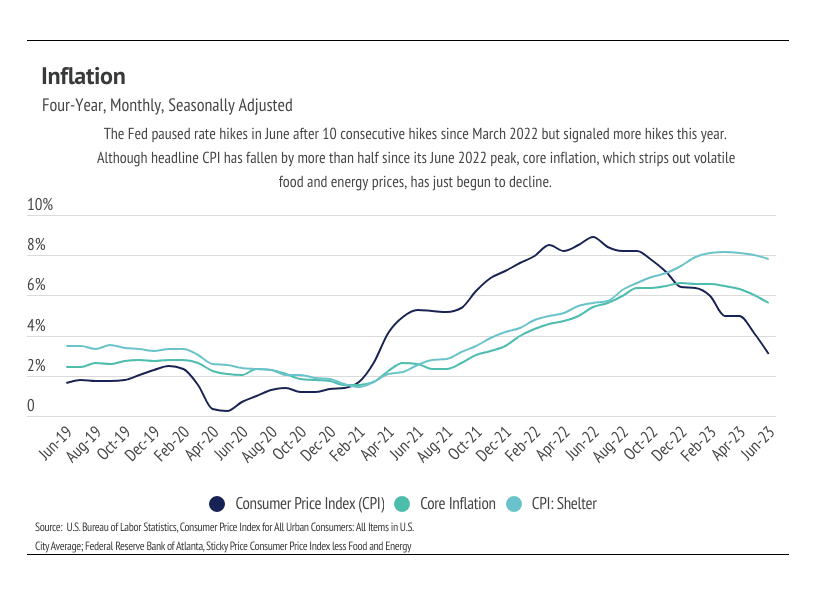
During the Fed’s July meeting, board members decided unanimously to raise the federal funds rate for the 11th time since March 2022 to its highest level since 2001. Although headline inflation (Consumer Price Index, or CPI) is down by nearly two-thirds since it hit 9% last June, core inflation, which removes volatile food and energy prices from the inflation calculation, has only declined 15%. A large component to core inflation is shelter. The CPI for shelter is only down 5% from the March 2023 peak. This isn’t exactly surprising, considering how close prices are to their peak. The Fed stated they would take future rate hikes on a meeting-by-meeting basis. However, this was before Fitch downgraded U.S. credit on August 1. At best, the downgrade will have little to no impact on interest rates, but if it does have any effect, it will move rates higher. The average 30-year mortgage rate hit 6.81% at the end of July and 6.90 the first week of August. Based on weekly data ending August 3, we expect the average 30-year mortgage rate to hover between 6.25% and 7.25%.
 
Different regions and individual houses vary from the broad national trends, so we’ve included a Local Lowdown below to provide you with in-depth coverage for your area. In general, higher-priced regions (the West and Northeast) have been hit harder by mortgage rate hikes than less expensive markets (the South and Midwest) because of the absolute dollar cost of the rate hikes and the limited ability to build new homes. As always, we will continue to monitor the housing and economic markets to best guide you in buying or selling your home.
 

Big Story Data

The Local Lowdown

Quick Take:
  • The median single-family home and condo prices are near all-time highs across Southern California. Orange County stood out, with both single-family home and condo prices climbing higher in July, reaching the third highest price levels on record.
  • Active listings fell from June to July, continuing an 11-month downward trend. New listings are selling incredibly fast, highlighting the challenges of buying a home in Southern California’s desirable markets.
  • Months of Supply Inventory has declined significantly in 2023, homes are selling more quickly, and sellers are receiving a greater percentage of asking price, all of which highlight an increasingly competitive environment for buyers.
Note: You can find the charts/graphs for the Local Lowdown at the end of this section.

Home prices near all-time highs

In Southern California, the housing market is always experiencing high demand, especially in the spring and summer months. The median single-family home and condo prices across Southern California are near their record highs. Single-family home prices in Orange County are only 2.2% below the record high reached last April. San Diego single-family home prices are also notable for declining off the all-time high reached last month, landing at its second highest price level on record. Although prices typically peak in May or June, 2023 is not a typical year. Prices could easily inch higher in August even if demand softens.
 
Typically, demand begins to decline this time of year, so the consistently low supply may become less of an issue. However, less of an issue doesn’t mean a non-issue. Quality new listings will certainly be sold quickly, while less desirable homes will sit on the market. This isn’t unusual, but it’s more apparent due to current mortgage rates. Potential homebuyers aren’t nearly as willing to pay a premium for a fixer upper as they were in 2020 and 2021.

Inventory hits new low for 2023 after an 11-month downward trend

Inventory has trended lower over the past 11 months, which is far from the seasonal norm. Inventory hitting a low in July only further highlights how unusual inventory patterns are this year. Typically, inventory peaks in July or August and declines through December or January. Currently, inventory is so low relative to demand that any amount of new listings is good for the market. The unusually low number of new listings from January through July 2023 has directly impacted both inventory and sales. The number of home sales is, in part, a function of the number of active listings and new listings coming to market. Since January 2023, sales jumped 42% while new listings rose 8%, whereas last year, for example, sales were down by July, while new listings were still up 21%.
 
As tight inventory levels continue, sellers are gaining negotiating power. In January 2023, the average seller received 94% of list price compared to 99% of list in July. Inventory will almost certainly remain historically low for the year, and the market will remain competitive in the third quarter.

Months of Supply Inventory continues 8-month trend lower, indicating a strong sellers’ market

Months of Supply Inventory (MSI) quantifies the supply/demand relationship by measuring how many months it would take for all current homes listed on the market to sell at the current rate of sales. The long-term average MSI is around three months in California, which indicates a balanced market. An MSI lower than three indicates that there are more buyers than sellers on the market (meaning it’s a sellers’ market), while a higher MSI indicates there are more sellers than buyers (meaning it’s a buyers’ market). MSI fell significantly in the first quarter, indicating the market moved from a balanced market to a sellers’ market, and it continued to trend lower through July. The sharp drop in MSI occurred due to the higher proportion of sales relative to active listings and less time on the market.

Local Lowdown Data


Let's Talk

You’ve got questions and we can’t wait to answer them.